Is the Arctic route really better? In numbers.
For the same ship, distance, days, fuel, CO2 and canal dues via Suez and via the Arctic, side by side.
Demo voyage
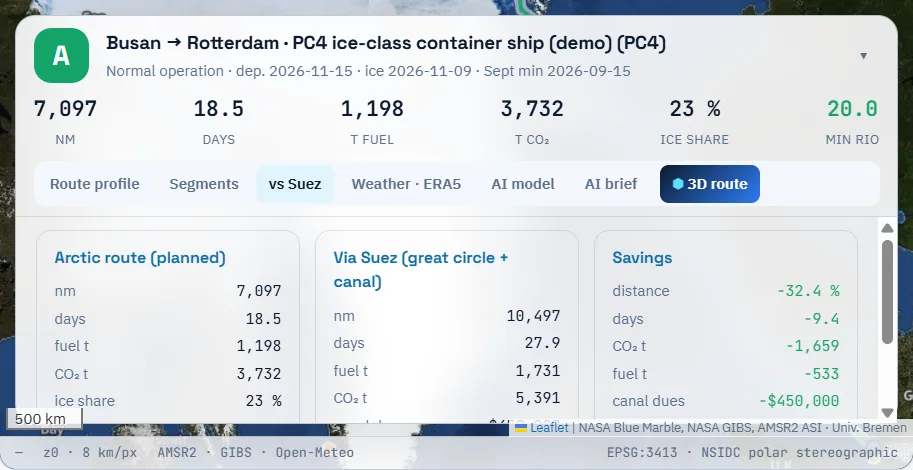
Busan to Rotterdam, 9.4 days shorter.
Worked example for a PC4 ice-class container ship (demo vessel), departing 2026-11-15 on the 2026-11-09 ice field.
| Arctic route (planned) | Via Suez | Difference | |
|---|---|---|---|
| Distance | 7,097 nm | 10,497 nm | −32.4% |
| Days | 18.5 | 27.9 | −9.4 |
| Fuel | 1,198 t | 1,731 t | −533 t |
| CO2 | 3,732 t | 5,391 t | −1,659 t |
| Canal dues | None | about $450,000 | −$450,000 |
| Ice share | 23% | None |
Demo-account example; real values depend on the ship, the ice and the speed plan.
Method
How is it calculated?
CO2 = fuel × factor (VLSFO 3.114 · MGO 3.206 · LNG 2.75 t/t)
Suez benchmark
Great-circle legs Singapore–Bab-el-Mandeb–Suez–Gibraltar–Dover plus 14 hours of canal waiting.
Ice correction
Legs in ice carry 20% more fuel, and lower permitted speeds add time.
Ready for carbon reporting
Voyage CO2 differences support IMO CII management and shipper reporting.
FAQ
Frequently asked questions
Can we use our own ship data?
Yes. Enter design speed, daily consumption and fuel type (VLSFO, MGO, LNG, HFO) when registering a vessel.
Is the Arctic route always better?
No. Heavy-ice seasons, lower ice classes, escort costs, insurance and permit conditions can favour Suez. That is why we compare each voyage on the same basis.
Get started
Try it on your own fleet’s voyages.
We walk you through the demo account and run your planned voyage on the latest ice field.