Sea-ice thickness, estimating it from satellite concentration and freezing degree days
To calculate polar route risk you need to know not only whether ice is there but also its sea-ice thickness.
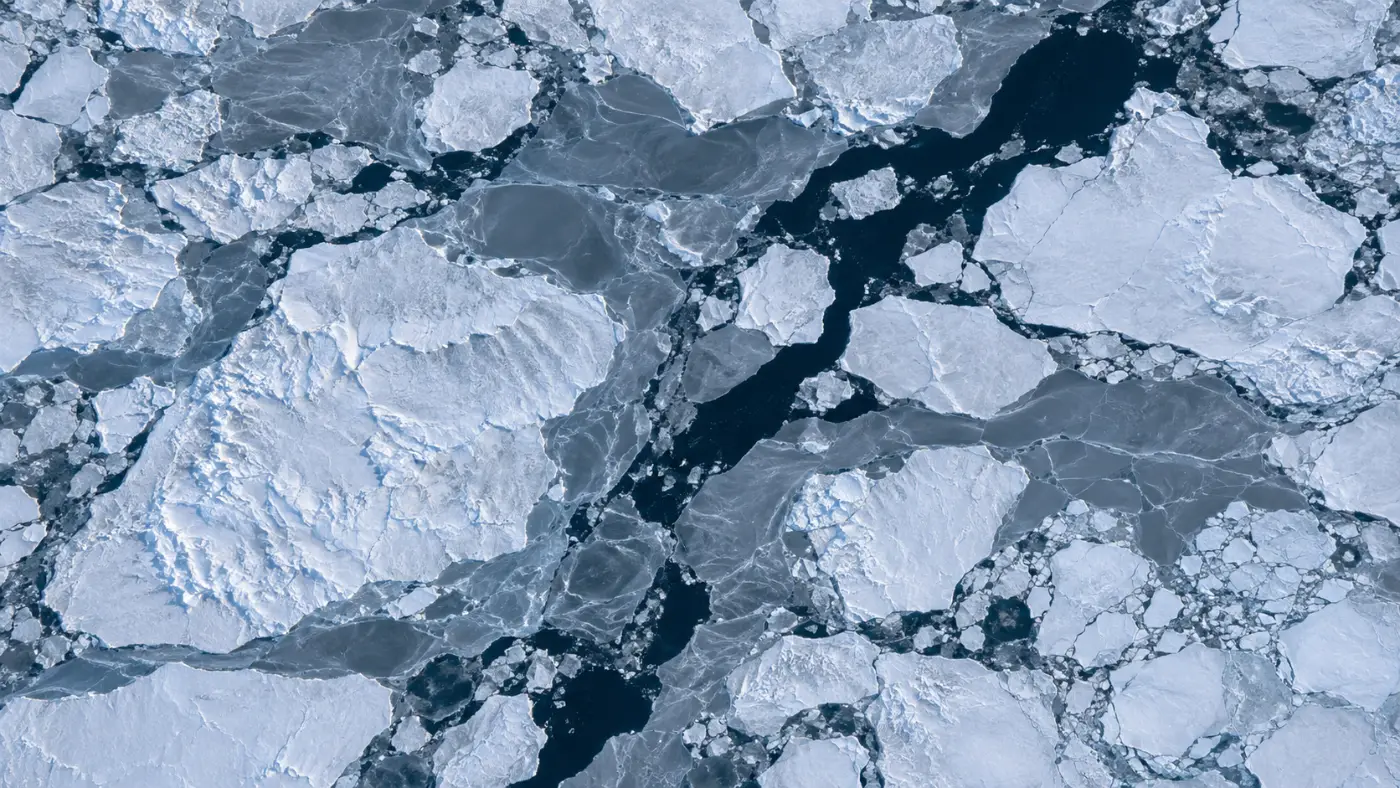
Arctic satellite maps show every day where the sea is frozen. Yet the same white sea can be ice as thin as a finger or as thick as a person is tall, and those mean very different things to a ship.
The international method for polar operating risk also gives different risk values by ice type, meaning by thickness and age. Coverage alone is not enough to count the risk properly.
Below we explain what satellites see every day, how accumulated cold is used to estimate thickness, how ice that survived the summer is identified, and the limits and validation plan. If you are reviewing data for polar routes, this may help.
Category: Sea-ice data
Sea-ice thickness starts with concentration from satellites
The main daily, Arctic-wide satellite data comes from microwave sensors. AMSR2, on the Japan Aerospace Exploration Agency’s GCOM-W satellite, calculates the share of sea covered by ice from the microwave contrast between ice and water.
Because it uses microwaves rather than light, it sees through cloud and in the polar night. In an Arctic winter where the sun does not rise for months, that matters a great deal.
POLARROUTE AI takes the AMSR2 sea-ice concentration product published daily by the University of Bremen. Its resolution is 6.25 km, and it is mapped onto the grid used for route calculation.
This value is coverage, though. It does not say how thick the ice is, so a separate step is needed to estimate thickness.
Accumulated cold gives the thickness
Seawater freezes downward as cold days pile up, so ice thickness is closely tied to accumulated cold. Adding up, day by day, how far the mean temperature was below the freezing point of seawater gives freezing degree days.
The link between freezing degree days and thickness has been studied for a long time. POLARROUTE AI uses the Lebedev (1938) relation and estimates thickness in centimetres as 1.33 times freezing degree days to the power of 0.58.
It starts from climatological freezing degree days, and points along the route are recalculated with ERA5 reanalysis temperatures (via Open-Meteo). A warmer year than normal gives thinner ice, a colder one thicker ice.
The estimate is labelled as a proxy on screen, so users always know it is calculated rather than measured.
Sea-ice thickness comes with the age of the ice
Age matters as much as thickness. First-year ice and multi-year ice that survived a summer differ in salinity and strength, and carry very different polar risk values. The US National Snow and Ice Data Center’s science of sea ice explains these differences well.
POLARROUTE AI uses around 15 September, when ice is at its minimum, as the reference. Cells with 70% or more concentration even then are treated as ice that survived the summer: second-year or multi-year ice.
Other cells are graded by estimated thickness into stages such as grey ice, thin first-year and medium first-year ice. This classification links to the risk value table for each ice class, which produces the risk index.
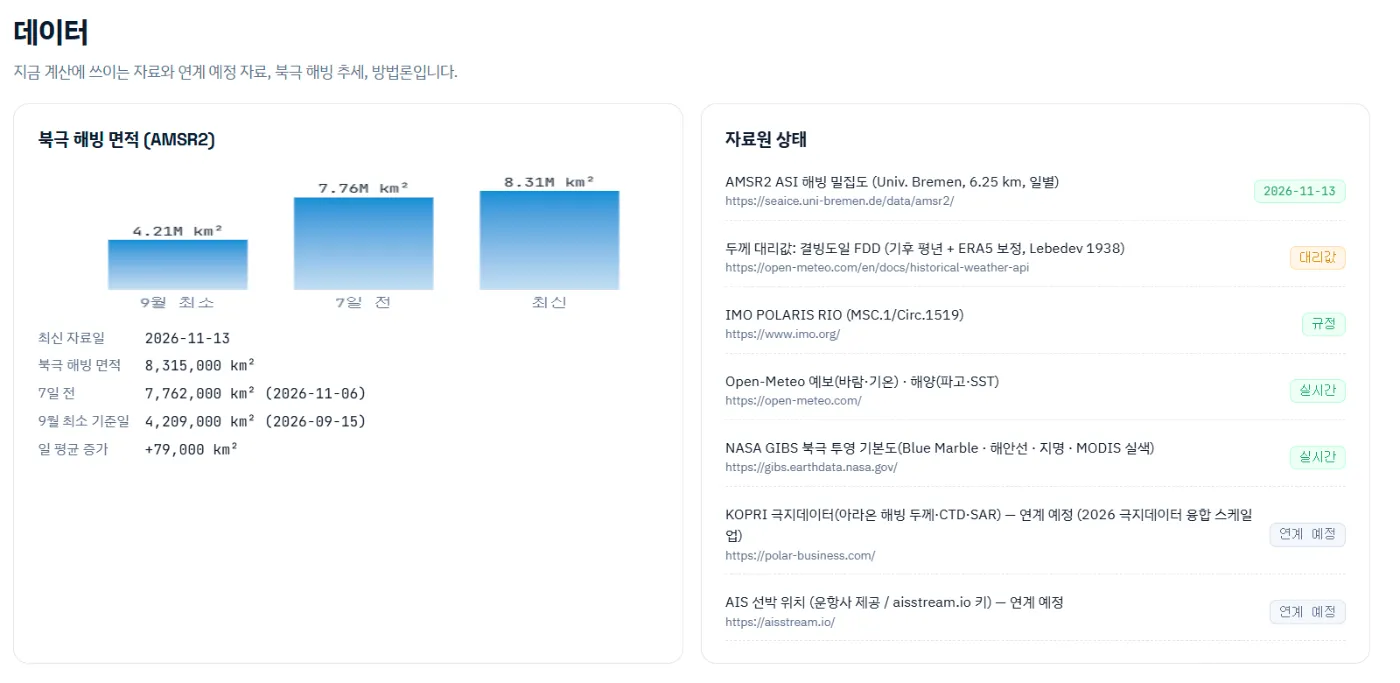
The same data drives the Arctic ice trend. On the demo screen, Arctic ice extent grew from about 4.21 million km² at the September minimum to about 8.32 million km² on 13 November, an average of 79,000 km² a day.
From concentration to thickness
Daily AMSR2 6.25 km concentration.
Add up sub-freezing temperatures day by day.
Apply the Lebedev relation.
Identify multi-year ice from the September minimum.
We plan to validate the estimate against measurements
The strength of this approach is that it covers the whole Arctic every day on the same basis. It uses a published relation and temperature data, so the calculation is easy to explain.
Its limits are clear too. It cannot see leads or icebergs smaller than 6.25 km, and ridges where wind has piled ice up are not captured by freezing degree days, so the estimate can differ from real thickness.
In upcoming pilots we plan to compare the estimate with ice thickness measured on polar research cruises. The target is a mean error of 20 cm or less; it is a target, not yet a result.
We have explained how thickness is estimated from satellite concentration and freezing degree days and where it falls short; the data sources and update cycle are described on the Sea-ice data page.
Frequently asked questions
Can the estimated thickness be used like official data?
No. It is a reference value for planning. Operating decisions should use official ice information and observations on site.
How often does the data change?
Concentration updates daily, and saved voyages can be recalculated with the new data.
Does it work for the Antarctic?
Calculations currently focus on Arctic routes. Antarctic use would need a separate review.
Want to see your next Arctic voyage in numbers first?
Give us a planned voyage and ice class. We run it on the live sea-ice field and compare the route, fuel and CO2 with the Suez benchmark.
Request a demo →Edited and answered by the MomentCube POLARROUTE team / james@momentcube.com · +82-32-212-1011