Arctic route, comparing distance, fuel and CO2 with Suez on the same basis
If an Asia–Europe operator is looking at alternatives to Suez, the first thing worth testing in numbers is the Arctic route.
That a northern passage is shorter is obvious from any map. The question in an operations-centre meeting is narrower: on this voyage, with this ship, departing on this date, how many days and how many tonnes do we actually save?
Answering it means putting both options side by side with the same ship, the same departure date and the same method. One is calculated around the sea ice, the other through the canal, and fuel and carbon must be counted with the same formulas for the comparison to be fair.
Below, using a Busan to Rotterdam worked example, we look at how distance and days change, how fuel and carbon are counted, what the calculation leaves out, and how operations centres use it. If you are studying an Arctic voyage, this may help.
Category: Arctic routes
Arctic route comparisons only work when the same ship is used
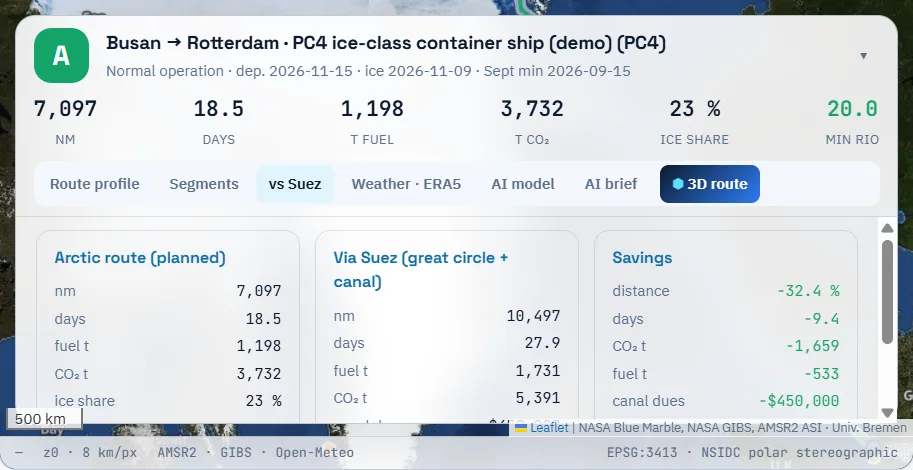
The setup is a PC4 ice-class container ship (a demo vessel with a design speed of 16 knots), departing on 15 November 2026, on the sea-ice field of 9 November. The voyage runs from Busan to Rotterdam.
On the northern side, the International Maritime Organization’s polar risk method is applied to every grid cell, cells where operation is not permitted are avoided, and the most efficient path is searched. On the Suez side, Singapore, Bab-el-Mandeb, Suez, Gibraltar and Dover are joined with great-circle legs and 14 hours of canal waiting are added.
The northern route came to 7,097 nautical miles and 18.5 days; the Suez route to 10,497 nautical miles and 27.9 days. Distance fell by about a third and sailing time by more than nine days.
Traffic in Arctic waters is tracked by the Arctic Council’s PAME working group in its Arctic Shipping Status Reports. As traffic grows, comparing each voyage on the same basis matters more, not less.
Fuel and carbon follow speed and time
Fuel is the ship’s daily consumption multiplied by the cube of the speed ratio and by time at sea. Ships burn far less fuel when they slow down a little, and the formula reflects that. A floor of 35% stops fuel from approaching zero at very low speeds.
Legs in ice carry 20% more fuel because resistance rises, and legs with low permitted speeds take longer, which adds fuel back. That is why fuel does not fall exactly in line with distance, and why the share of the voyage spent in ice changes the result.
Carbon uses a factor for each fuel: 3.114 tonnes of CO2 per tonne of very-low-sulphur fuel oil, 3.206 for marine gas oil and 2.75 for LNG. In the example, fuel fell from 1,731 to 1,198 tonnes and CO2 from 5,391 to 3,732 tonnes.
These figures are in a form you can use for the IMO Carbon Intensity Indicator (CII) rating and shipper reporting. Because both routes for the same ship are counted with the same formulas, the numbers can go straight into a briefing.
Arctic route calculations leave some conditions out
The result is an example under stated conditions. A real decision has to weigh a few things the calculation does not include.
The first is season. Mid-November is when sea ice grows fast: on the demo screen, Arctic ice extent rose from about 4.21 million km² at the September minimum to about 8.32 million km² on 13 November. A departure only a few days later changes the risk index and the permitted speeds.
The second is ice class. On the same path, a ship with a lower class gets a lower risk index, which means slowing down or meeting legs it cannot pass. The third is cost and process: icebreaker escort fees, insurance terms, transit permits and sanctions compliance are not in the calculation and must be checked by the operator.
Canal costs move too. The canal dues of about 450,000 dollars in the example are an estimate; actual tolls follow the Suez Canal Authority and the ship’s particulars.
Busan to Rotterdam (demo-account example)
10,497 nm
7,097 nm (−32.4%)
27.9
18.5 (−9.4)
1,731 t
1,198 t (−533 t)
5,391 t
3,732 t (−1,659 t)
about $450,000
none
Operations centres compare departure dates
The most common use is to repeat the same calculation for different departure dates: how the minimum risk index moves if the ship waits a day, and how many days an escort would save, all in numbers before the meeting.
Saved voyages are recalculated in one go when a new ice field arrives. Looking at the results from a week and two days before departure side by side shows clearly how much the ice drives the decision.
Results come with leg-by-leg advice and a briefing that can be shared with the ship and with shippers. The tool is still a screening aid: it does not replace official ice charts, transit permits or the master’s judgement.
We have walked through how to compare the two routes on the same basis and where that comparison stops; the method is described in more detail on the Suez comparison, fuel & CO2 page.
Frequently asked questions
Can we apply the example numbers to our own ship?
No. Daily consumption and design speed differ by ship, so the result changes. Enter your ship’s particulars and run it again.
Can ships use this route in winter?
It depends on ice class and ice conditions. In winter more legs fall to a low risk index, so a higher class or an escort may be needed.
Can we use the CO2 savings in reports?
As supporting material with the calculation basis, yes. Official reporting should use fuel actually consumed on the voyage.
Want to see your next Arctic voyage in numbers first?
Give us a planned voyage and ice class. We run it on the live sea-ice field and compare the route, fuel and CO2 with the Suez benchmark.
Request a demo →Edited and answered by the MomentCube POLARROUTE team / james@momentcube.com · +82-32-212-1011